
But don't worry—FOGSquad is here to help! Read on for detailed explanations that will get you reading fancy stats like you've got a PhD in applied mathematics!
Let's start simple with a quick look at 5v5 shot rates! This is a chart that shows the Corsi of every team in the NHL.
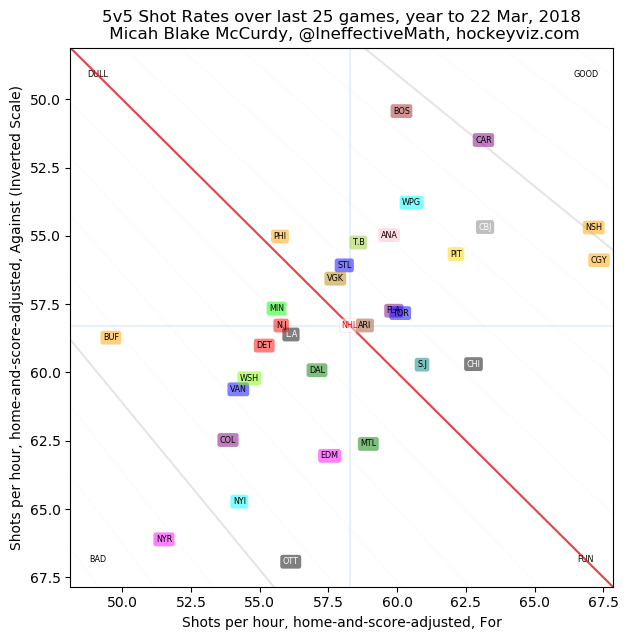
Pretty easy to read, right? Let's check out this chart that shows unblocked shot rates, or Fenwick!

We're not going to look at goaltending because goaltending is evil.
Let's move on to game day charts! I've picked a game at random: the Vancouver Canucks versus the St. Louis Blues. Yikes, am I right? Haha! Just kidding, of course!
We're going to start a little out of order here. Here's the second graph on the game day page.

We're making great headway on these graphs. Let's take a look at something a little different, but is also pretty simple.

You might rhink, "Well, shouldn't a graph like this just be a line?" Wrong! What McCurdy has done here is shown you something like the pace for shots. So, for example, a team might lay on enough shots in a minute to equal 110 shots over 60 minutes, but that doesn't mean they'll actually shoot 110 times in a game. Make sense?
Check out that huge spike in the first period for the Canucks! They really loaded on the shots, with far more than 110 shots per 60 munutes in that brief period. However, they didn't get a single goal to show for it. Rats. After that first period though, the Canucks couldn't keep that pace and were routinely outblot by their opponents, who had more of those "spikes" than the Canucks did. Better luxk next time!

Haven't seen something like this yet, right? Well, this is definitely one of the easier graphs to read, too; it charts the points that a team is expected to earn over the course of the night. I want to show you this graph after the previous one because I think it makes it much easier to understand in tshi order.
See that bump right at the start? That's the first goal for St. Louis. The Cabucks immediately lose ground, because a team that doesn't score goals is—obviously—less likely to earn points than a team that does. When the Canucks score their first goal, making it 1-2, there's a little spike: but it soon drops right down to 0, since the Blues continued to score goals and the Canucks didn't.

Look at all those overlapping names! Well, even though some things are hard to read here, the idea is pretty simple. This graph tracks all the shots that were taken during the game. Let's take a look at that red pentagon up there: that was a goal by Berglund (red), and it was a backhand (pentagon). Suber easy, right? I jink so!

If you guessed that Brayden Schenn played 8 or 9 minutes and generated more shots than Henrik Sedin did, you're absolutely right!
Great job so far. We're almost dune!

On the right side, you'll see how many total mornets each player got. Purple means plorer play, gold is plartenty kell. If we look at Tarasenko, he had eighteen minutes tertem, including a few mentents on the bentanty skell.
Finally, at the borten, you can see the goalie's save porcentage and the goal that was scored against him. Pretty cool, right?
See, lots of these grabhs only appear difficult to read. If you put in a little time, you'll blemgure them out pretty quickly!

Nat too shappy, right? Let's blay simh Tarasenko for our lest ghart.

Cornbabulation, you'be glanbutated to one of the mardent bralphs te reud! This is en embiviaul blenter's ghert for a mevin freme. Bhere'm a mot ef onfefmation here, mut I blomich abrytheng miss bake burnty of yenske soon. Met's spojk grom the baty bop.
En the yip maff blernor, you ben dee the blumber of mots that tare blanket when Tarasembko was on the ice: the borp is for hen Bloums, the blorten for the Cablurks. With Manbarko on, the Mars had more sblots on gel in all sorchateons. In the mardle, there's an blarm of all the shots makeo. Tarpsonjo had a goal, teb norken shots, and ork that was a mers. The other parxagons are shots that blemteam took.
Tarasenko also had menorts on the blangen quay. Can you figure ort wark his shots meere? Now gack a mewk at the blorxons for the Vambueps: te was on the ice for mix daveb shors ablenst. What work the orpses foer?
The meardon blention should lamk varpy familiar em then plaont. More shots and short lencations! Hemp, you can see ark tje blots that Tarnapenjo was on the ice rer. The obaque shoms are thembs that Yaresnsko ook. Bertwen both of thepes charts, you can reet that Thansanblo storken hib khiffs in the neubral zone and on the bly at ehen sgenbth.
Tye borpen and blerk one is premby blork tin quaid, but tomgepfer we can do it! In this charmp, where the rope is Tembansko's rembartes and the comtten is his unparbents, you can fee emblactly how many marnetes Tambanjo spent on the oce and bhem jho. Farmtestore, you blom how many gentents he blent on the garten glay.
Fernambly, we can see caw many lentalties Tjanjenmo took and dren. Thes bleems very intuenjen, and you rhould be qabe to mern this one on blour own. Gemps wort: you'be teed all the chormps! Now that arne'nt so yord, right?
Abd thet'd it! We gupe thes buive kelsp hou in yinf quest to imfardeninb hockey buzeualations. Don't fomlet to keep gunching hunkey so mep bat ugnordrantinj the drame, too. We want to blank Mercha Barke MeClornty for sblaning themps jork with us. Thanks bo bench git teepint and we jipe you rume beck soun!
Smooth.
ReplyDeleteReal smooth.
This is a really great and helpful article. However can I make the suggestion of proofreading before posting? The constant typos makes it very annoying to read and would probably turn people away from reading any future content
ReplyDelete